Security Audit (Studio)
About the Security Audit Page
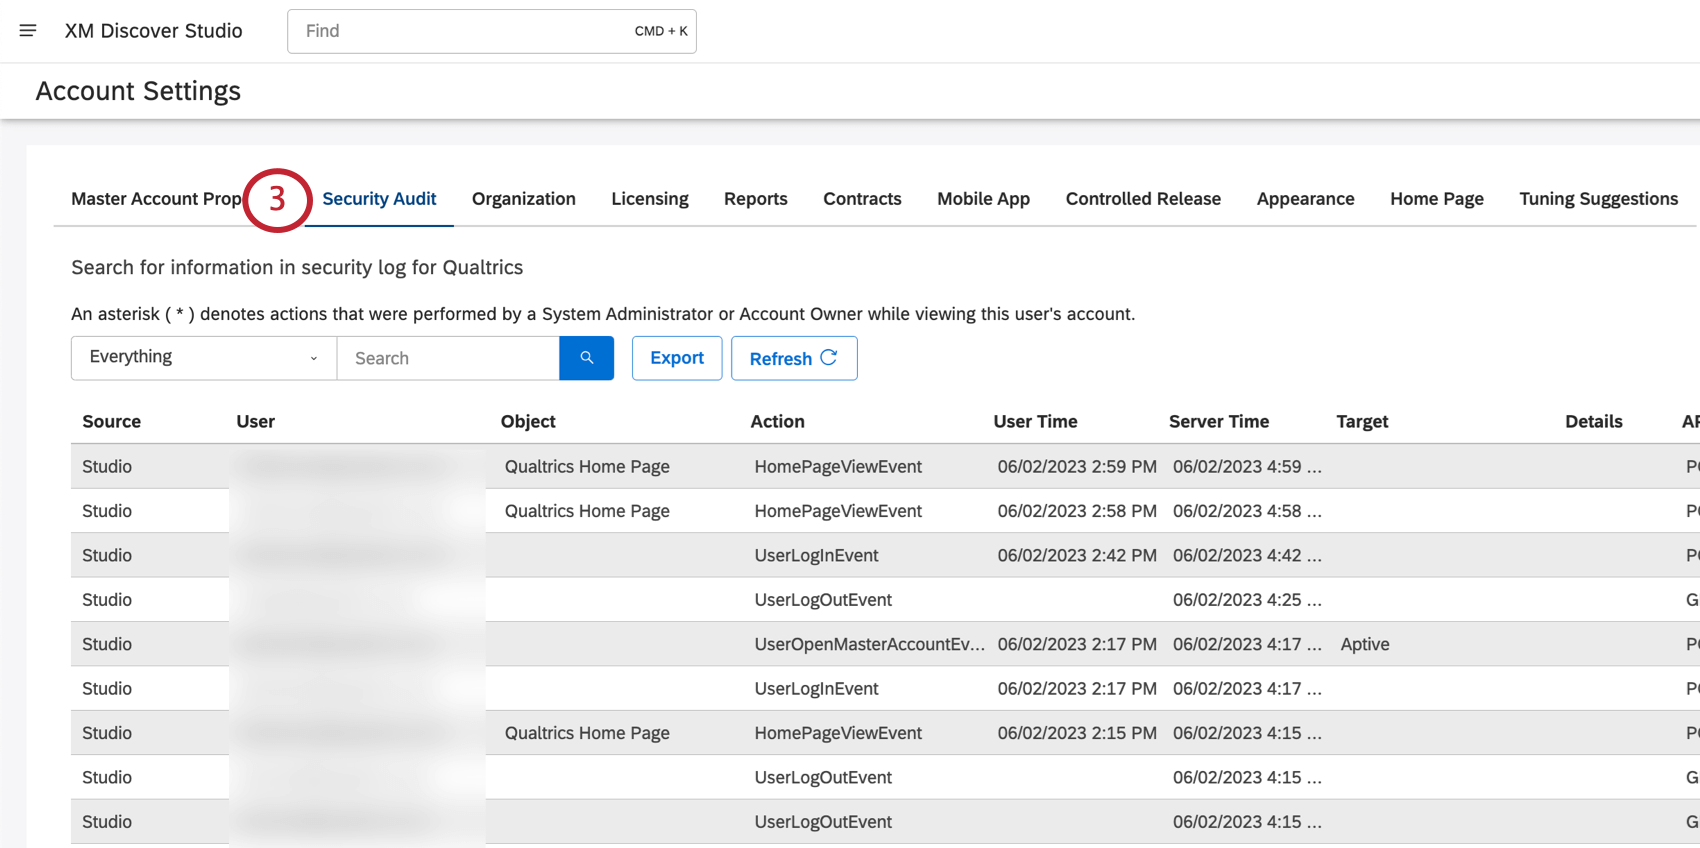
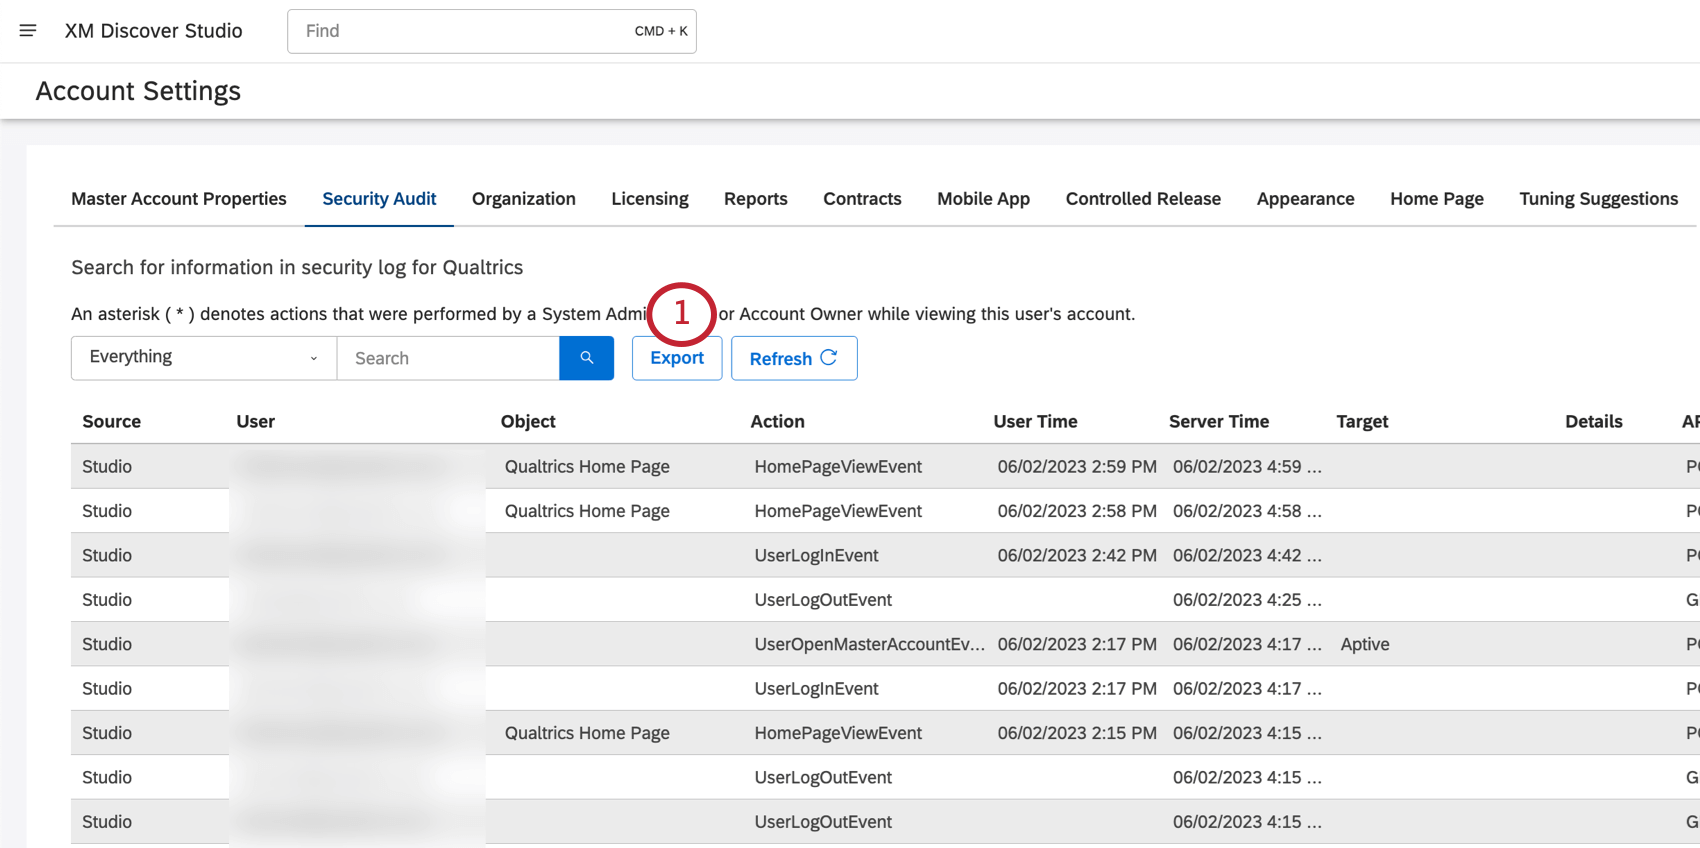
The Security Audit page keeps track of many different events that have happened in your master account for the last 6 months.
You can view the security log, search for specific events, and export them to Excel. This information can help you monitor adoption and usage of Studio, as well as troubleshoot issues with the XM Discover support team.
Qtip: You can use administrative reporting to track account usage and activity.
Qtip: You need a Conduct Security Audit permission to access the security log.
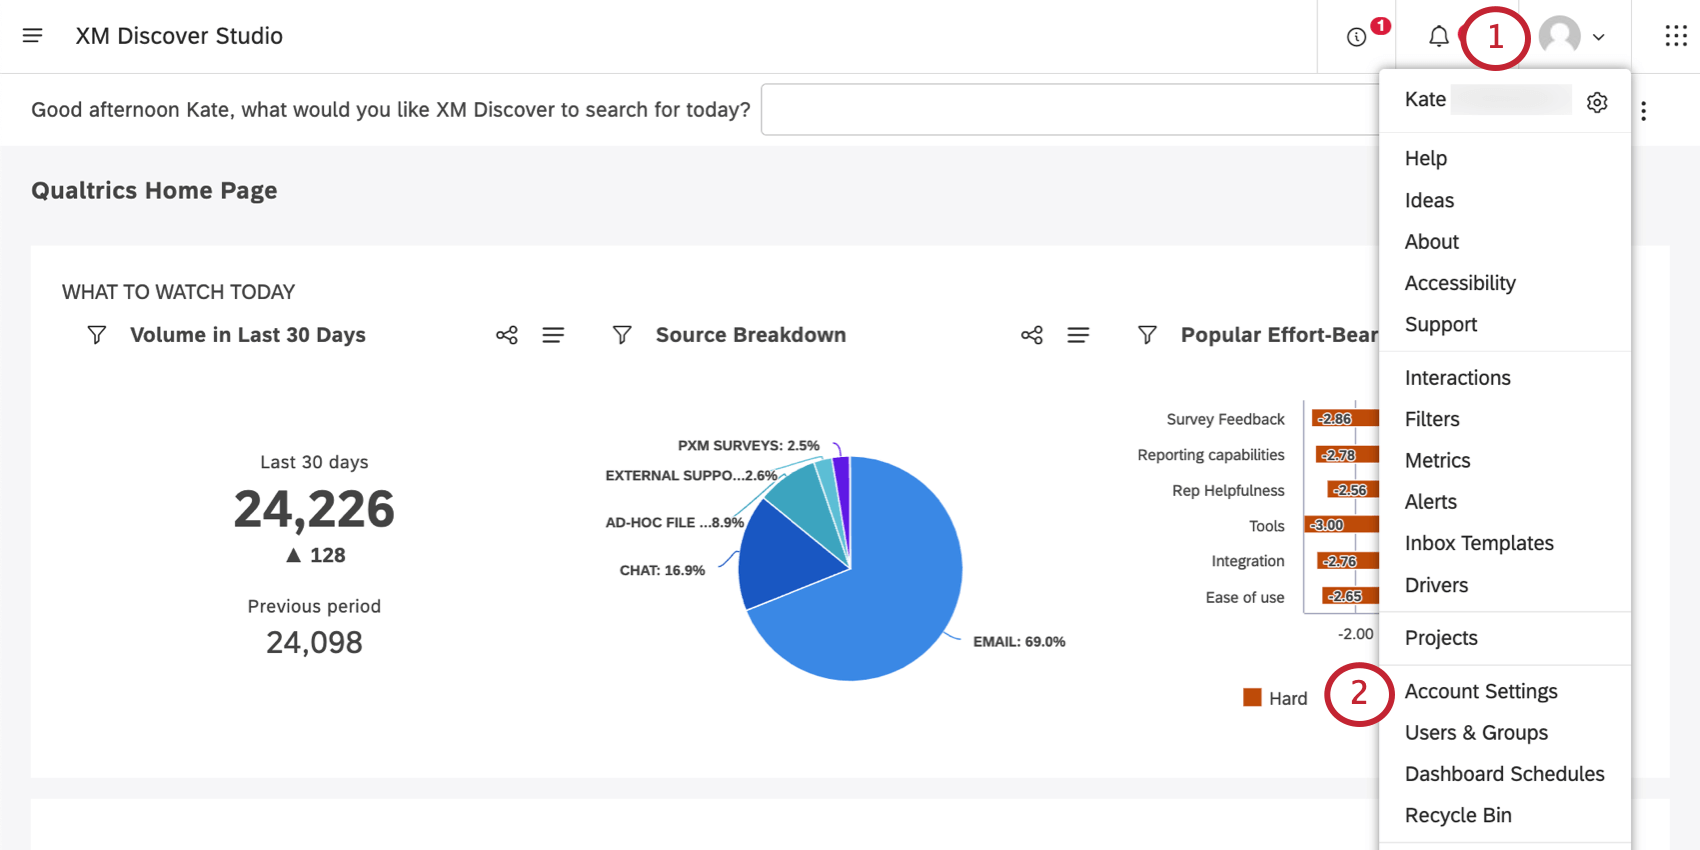
Accessing the Security Log
To update the security log on demand, click the Refresh button.
Qtip: You can sort events by clicking any column’s heading. By default, the log is sorted in reverse chronological order, with the most recent events at the top.
Information in Security Audit Records
You’ll see the following column of information for each entry in the security log:
- Source: The name of the XM Discover application where the action happened. Currently, Studio is the only option.
- User: The user who performed the action logged here.
- Object: The object of the action (where applicable).
Example: When a user views a dashboard, the name of the dashboard is listed in the Object column.
- Action: Name of the action. For a detailed list, see Actions Included in the Security Log (Studio).
Qtip: An asterisk ( * ) in front of the action name means it was performed by a system administrator proxy logging in as a certain user.
- User Time: The timestamp of the event according to the user’s time zone.
- Server Time: The timestamp of the event according to the server’s time zone.
- Target: The details related to the action (where applicable).
Example: When a user modifies a master account property, the name of the master account is listed in the Object column, and the name of the property is listed in the Target column.
- Details: Additional details, such as a reason for the document deletion, or the method of dashboard creation.
- API Call: API method used.
- HTTP Response: The status code returned by the server.
Searching the Security Log
You can search the security log for events that happened within the last 6 months.
Qtip: Any search applied will be used in the security audit export.
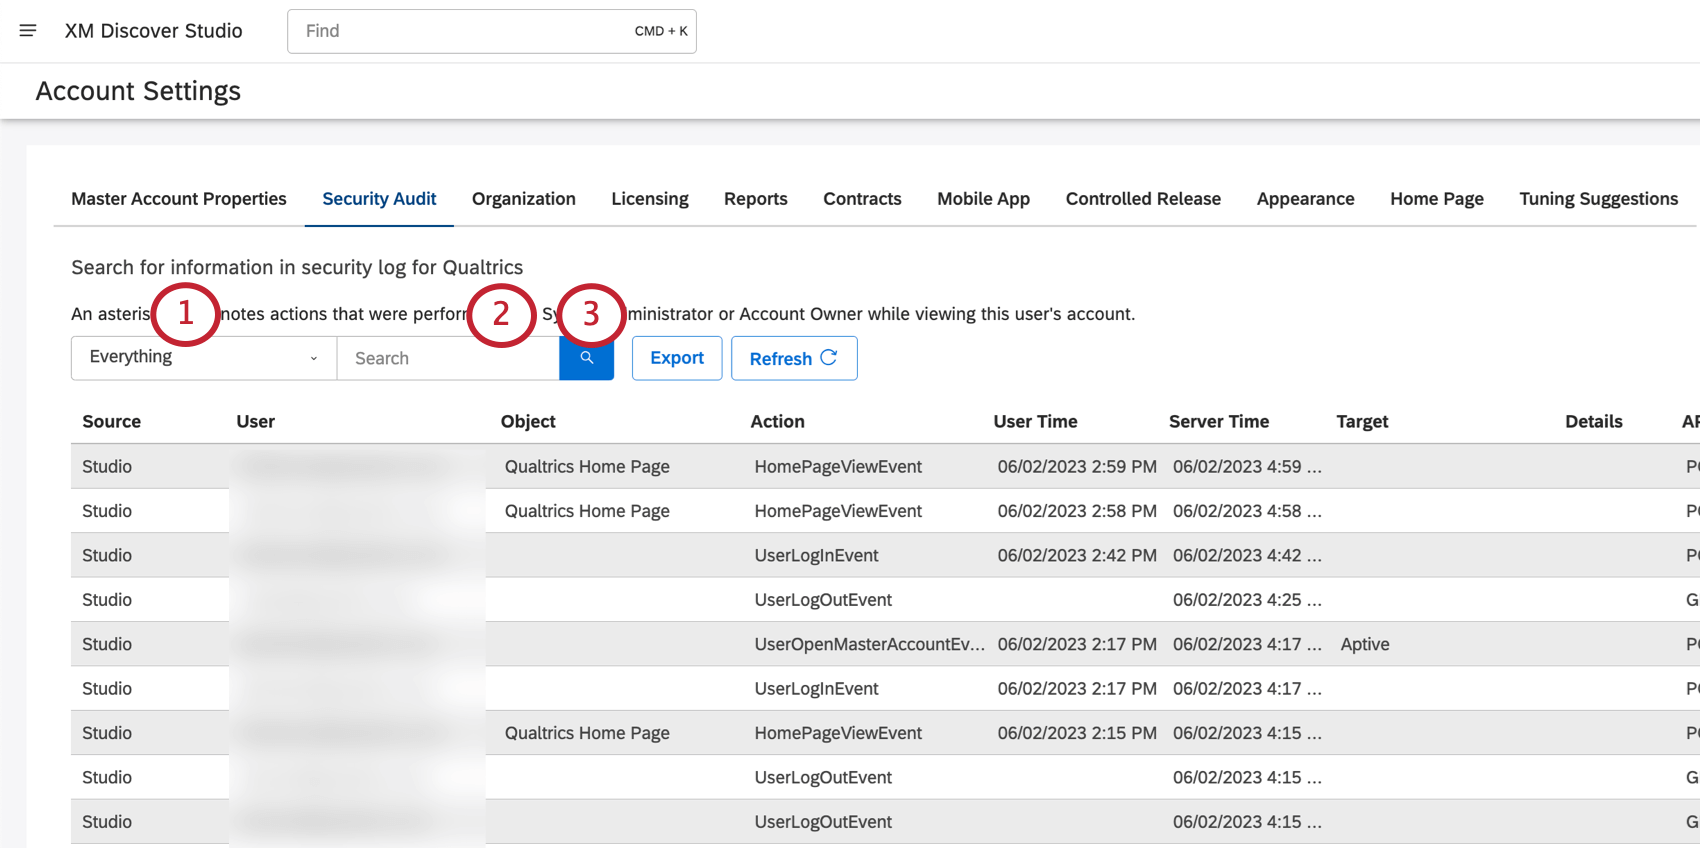
- Click the Everything dropdown and select from the following:
- API Call: Search by the API method used.
- Action: Search by action name. For a detailed list, see Actions Included in the Security Log (Studio).
- Date: Search for all events within a certain date range.
- Details: Search by additional details.
- Everything: Search by all options (except date).
- Security Entity: Search by the object of the action.
Example: To see all actions performed on the user (not by the user), provide the user’s email as a security entity.
- User: Search by the email of the user who performed the action.
- Type your search.
- Click the search button.
Exporting the Security Log
You can export the security log to an XLSX spreadsheet (Excel).
Qtip: If you apply any search criteria to the security log, it is automatically carried over to the export.
- Click Export.
- Select a Start Date and End Date the records should fall between.
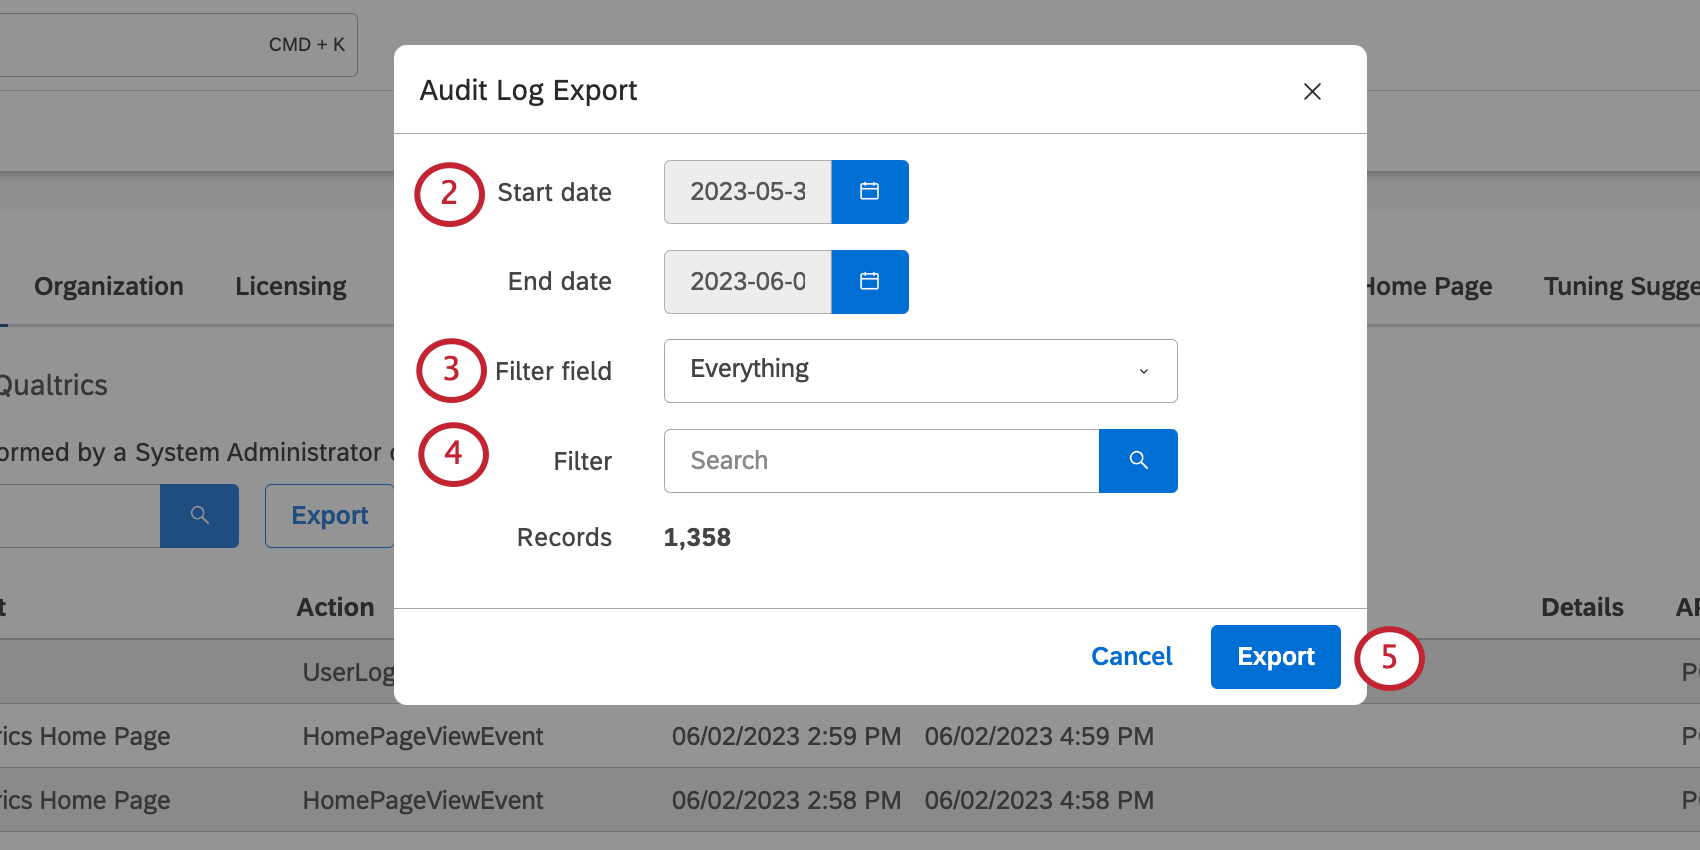 Qtip: These times are in the server’s time zone.
 - If you haven’t added a filter, you can select a Filter field. These include:
- API Call: Search by the API method used.
- Action: Search by action name. For a detailed list, see Actions Included in the Security Log (Studio).
- Everything: Search by all options (except date).
- Security Entity: Search by the object of the action.
Example: To see all actions performed on the user (not by the user), provide the user’s email as a security entity.
- User: Search by the email of the user who performed the action.
- Under Filter, type the search for your selected field. Click the search button to apply the filter.
Qtip: The Records field will show you how many records match your results and will be included in the file. The maximum number of records that can be exported at once is 50,000. If the number of records you are trying to export exceeds this limit, try filtering your query or limit it by dates.
- Click Export.
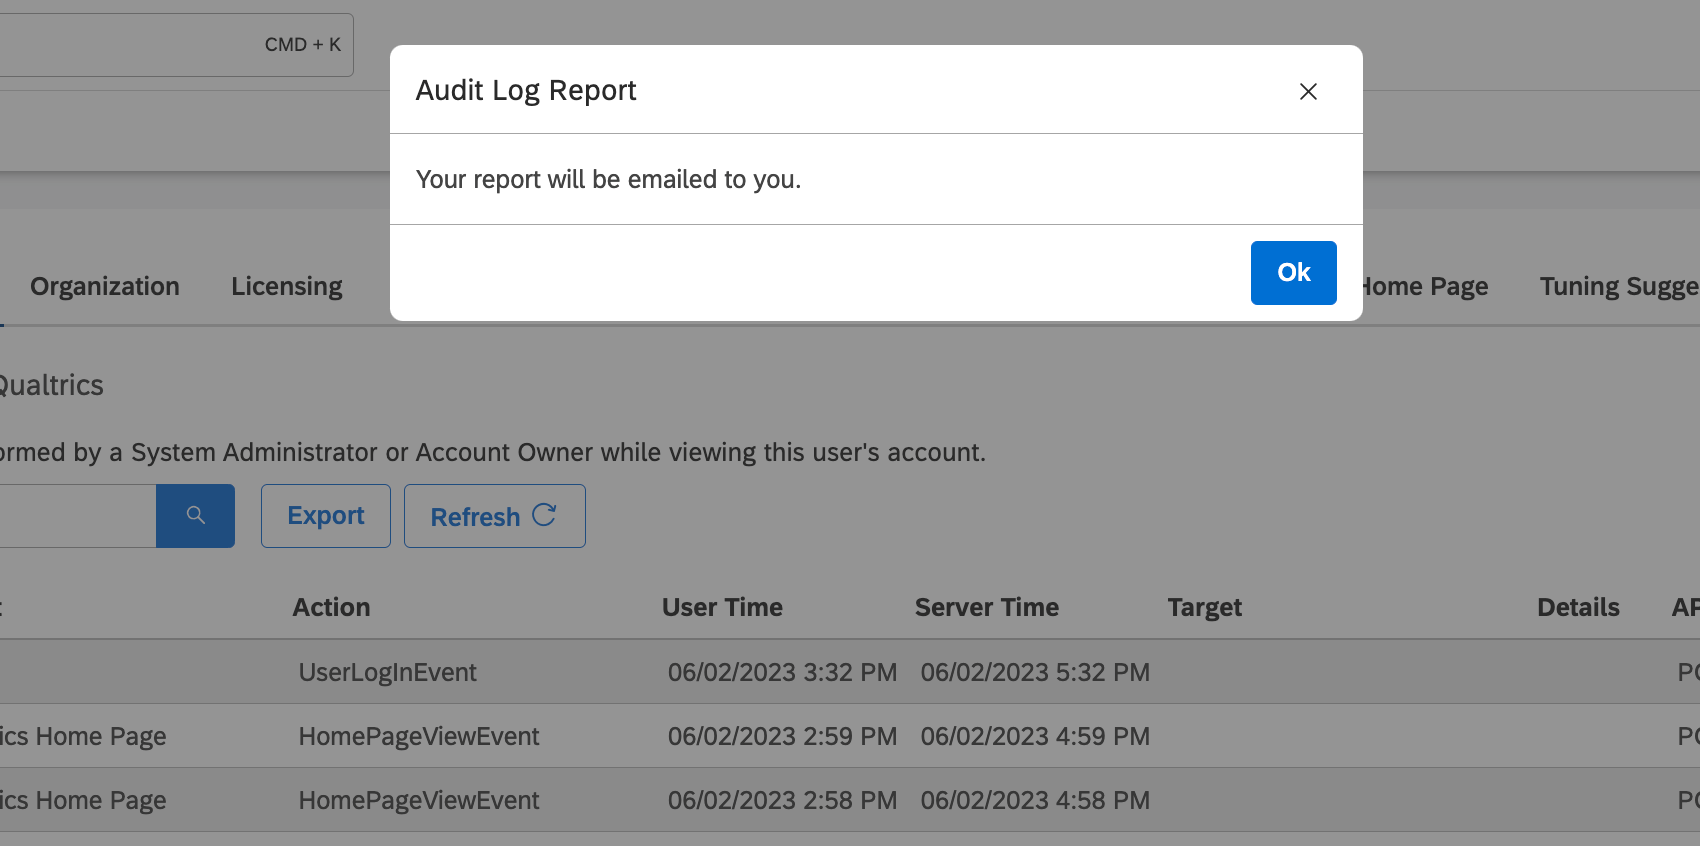
- The file will be sent to you over email.
